Adding Plots
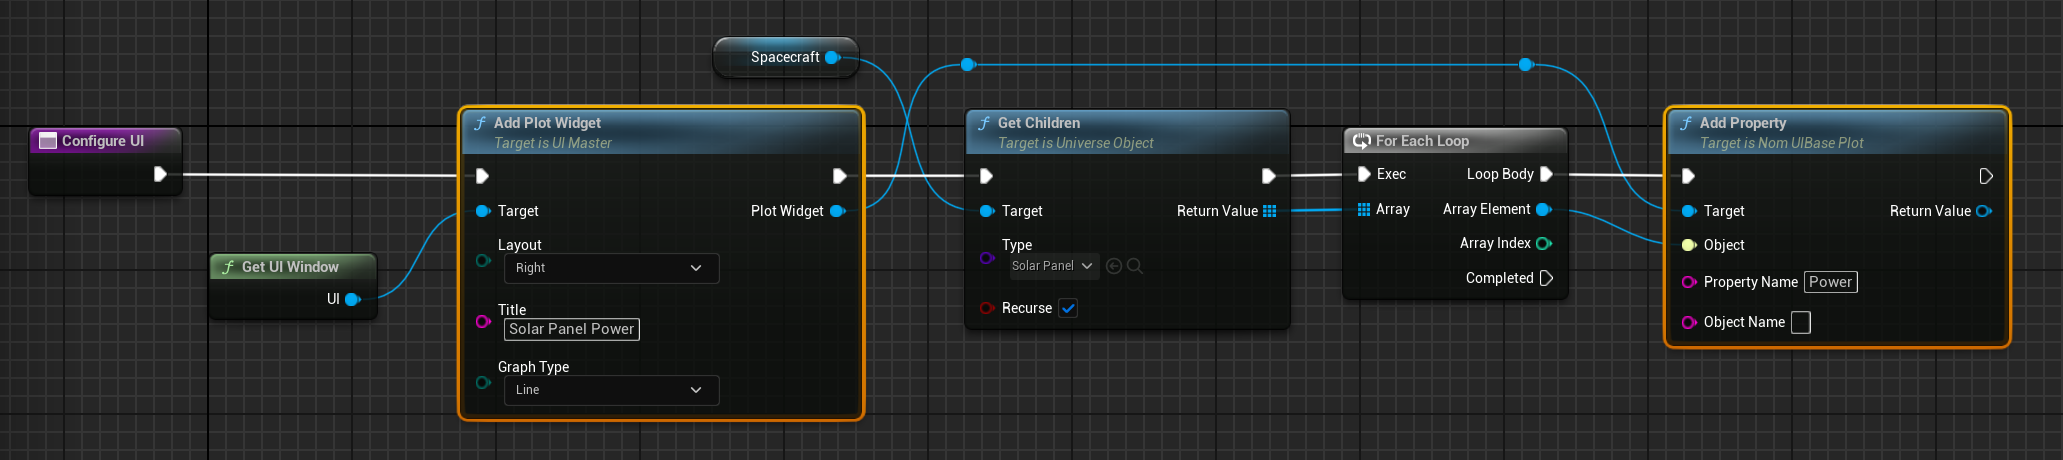
Similar to the previous tutorials, the user interface can be added similarly, using the Get UI Window function. Three new plots will be added for the first part of this user interface design. One will show the power produced by the two solar panels on the same plot, the second will show the charge of the battery and the third plot will show the resistance of the power load.
The solar panels can be fetched from the spacecraft using the Get Children function for the first plot. The data can be added using the Power property on the Add Property function.
The second graph is the battery charge. This can be added using the same method, using the Charge and Capacity properties from the battery.
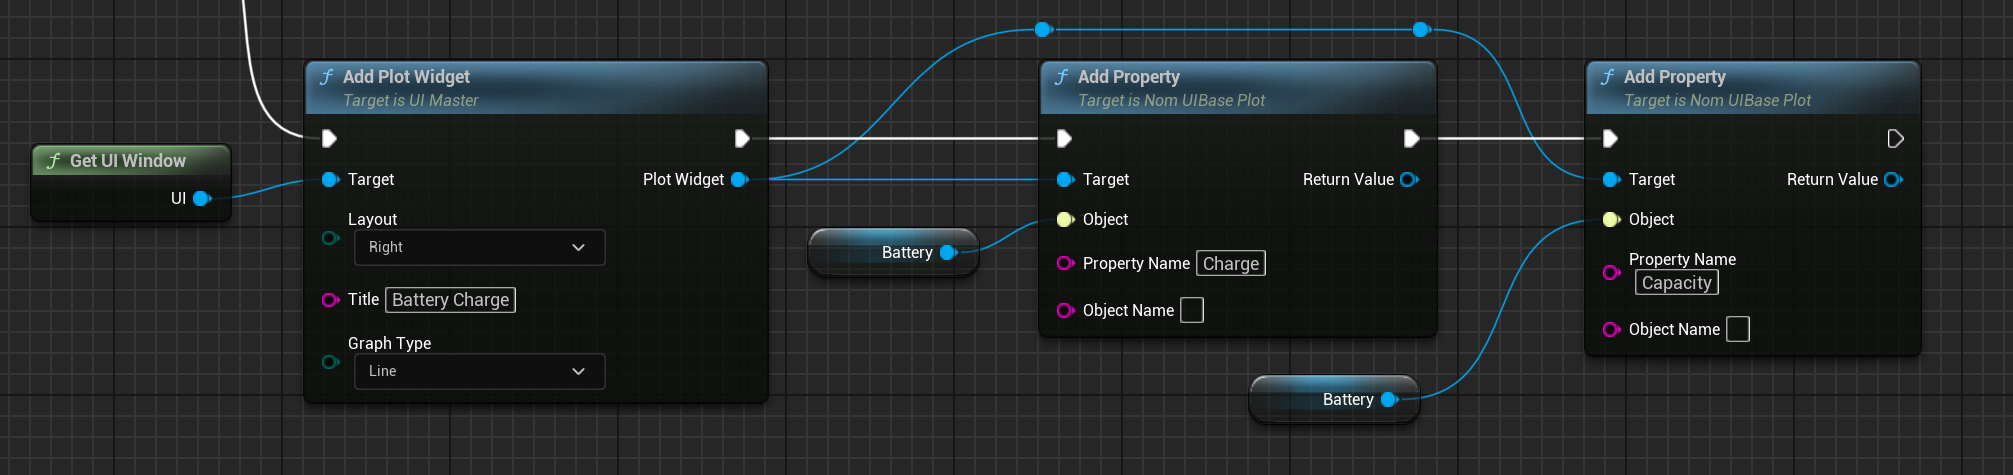
NOTE
Make sure to create the following plots on the
Completedexecution pin from the solar panel code, to ensure it does not happen for each solar panel as there is only one battery.
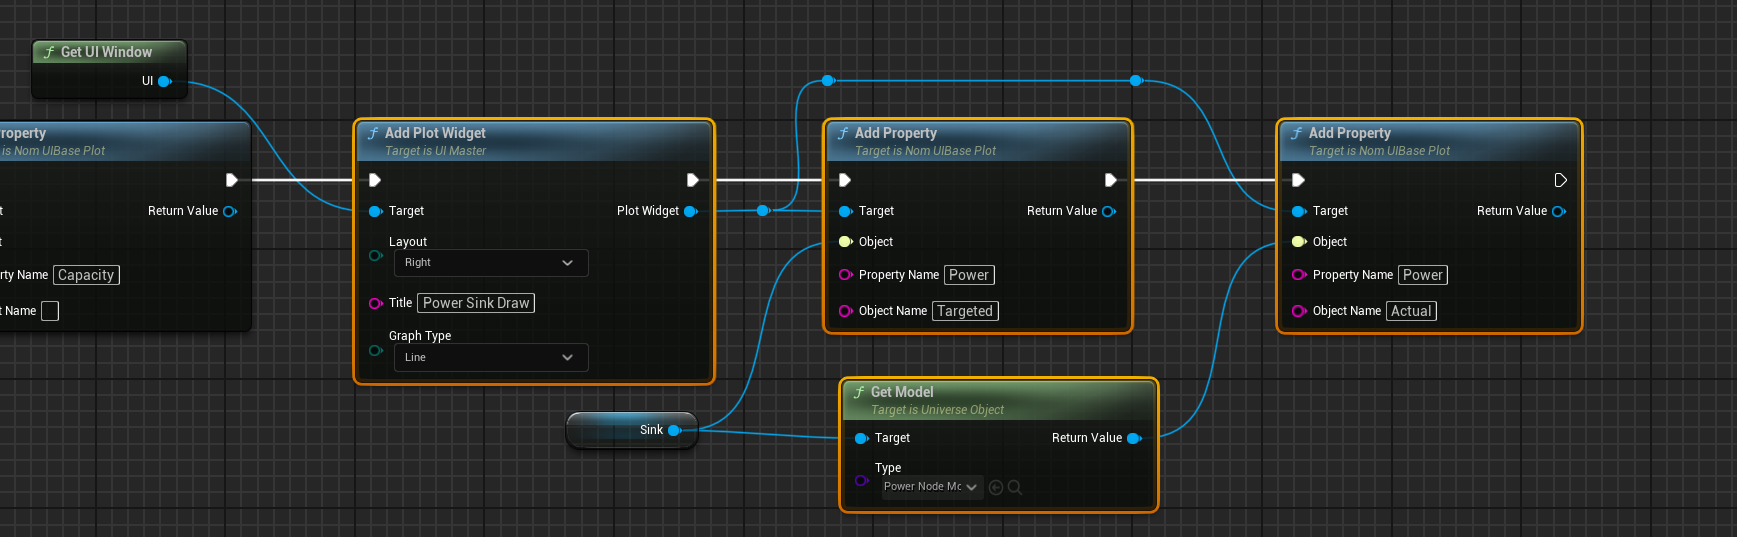
The final graph will be plotting the power from the power sink. At this stage, the power will be consistent and will not be changing over time. This will be added to the following tutorial section. For now, the Power from this component will be plotted over time. For a power sink, the power value is the power that is attempted to be drawn. The actual power drawn is found on the Power Node Model which can be found using the GetModel function.
Ticking the Simulation
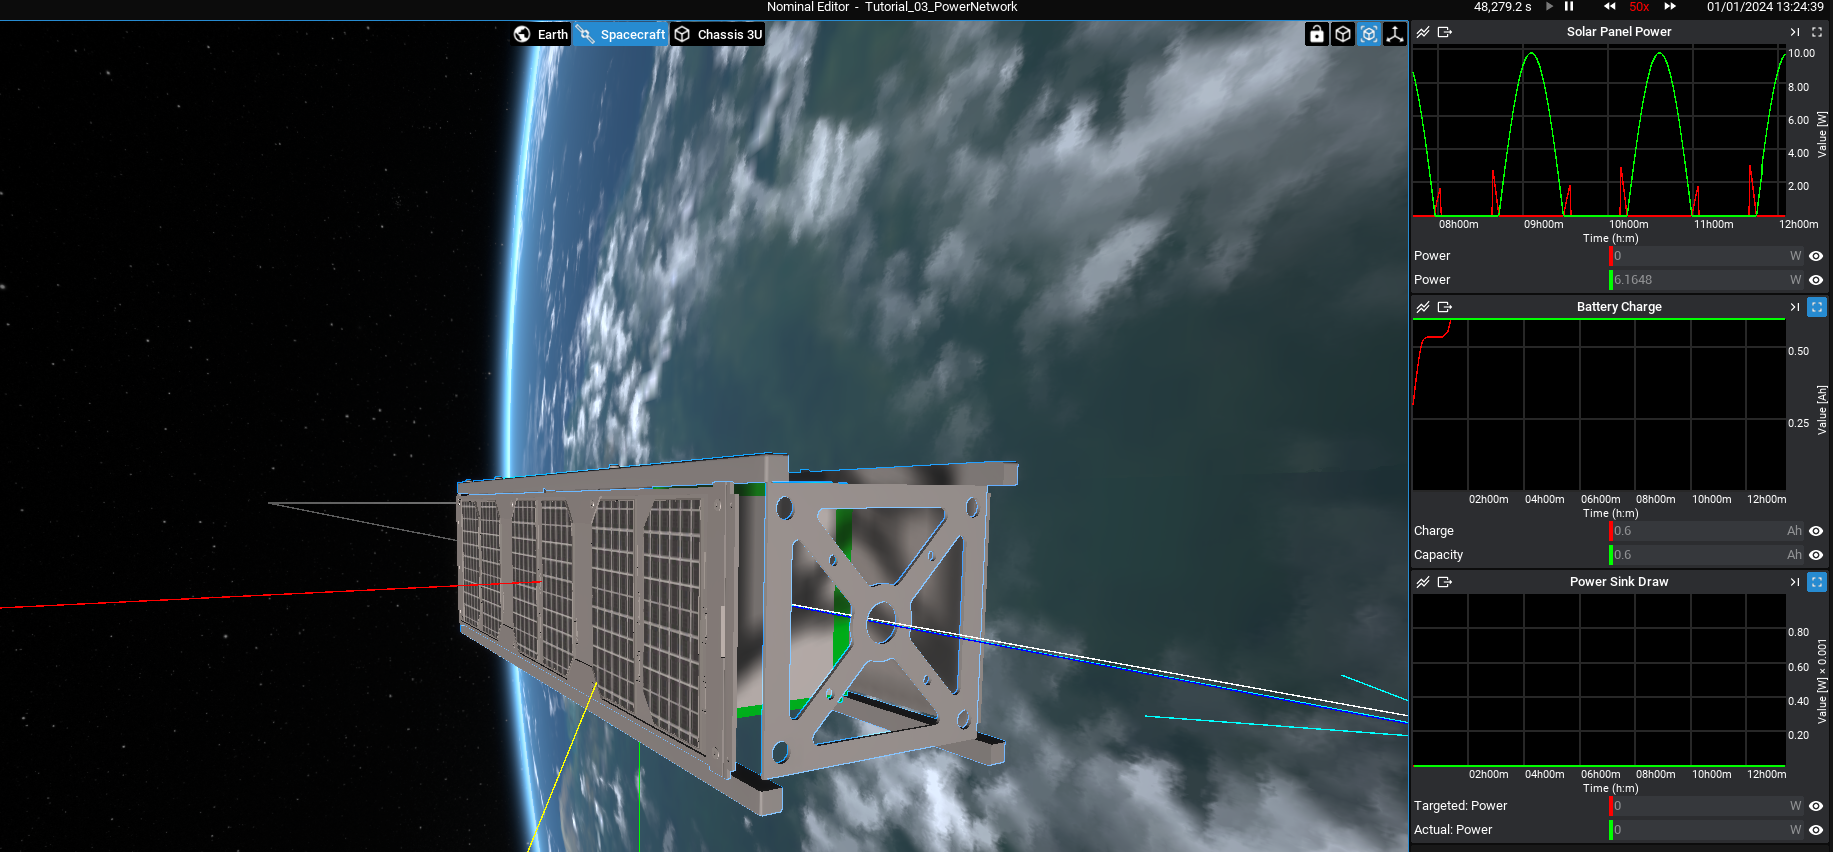
When the simulation runs, the solar panel power will reach a maximum once the pointing mode is achieved. Over time, as the sun moves away from the spacecraft’s direction, the solar panel power will decrease. The battery will slowly charge up from the solar panels over time, as seen in the second graph.
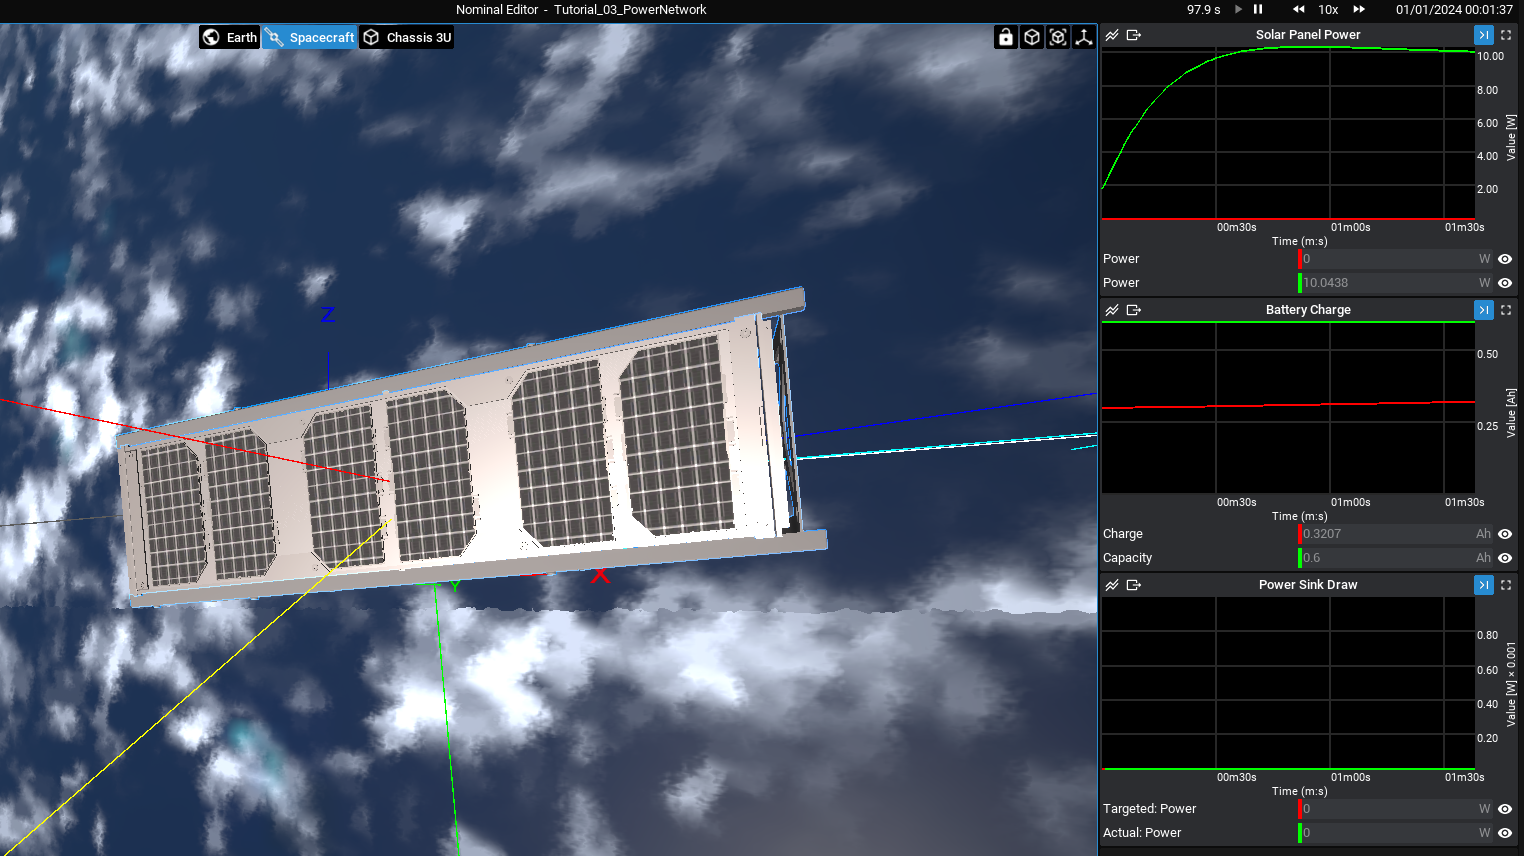
The plots have a few buttons on the top panel that can be pressed. From left to right, they are:
- Plot Type: Enables switching between line graphs and bar charts.
- Export: Outputs all data from the plot to a CSV file that can be saved in a desired location.
- Recent View: Selecting this will snap the graph to follow the current time of the simulation. This is on by default unless scrolling the timeline.
- All View: This will show all data in the same timeline, from the start of the simulation.
As an example, clicking the ‘All View’ button on each plot will show the data over the entire simulation, regardless of how long the simulation has been running:
NOTE
The export button will output data from the entire simulation of recording, regardless of whether that data is within the plot view or not.