Navigating to the plots sections enables the user with a data analysis focus to run through all the decrypted downlinked data. This will be most used for fault finding and anomaly detection.
Data Plotter
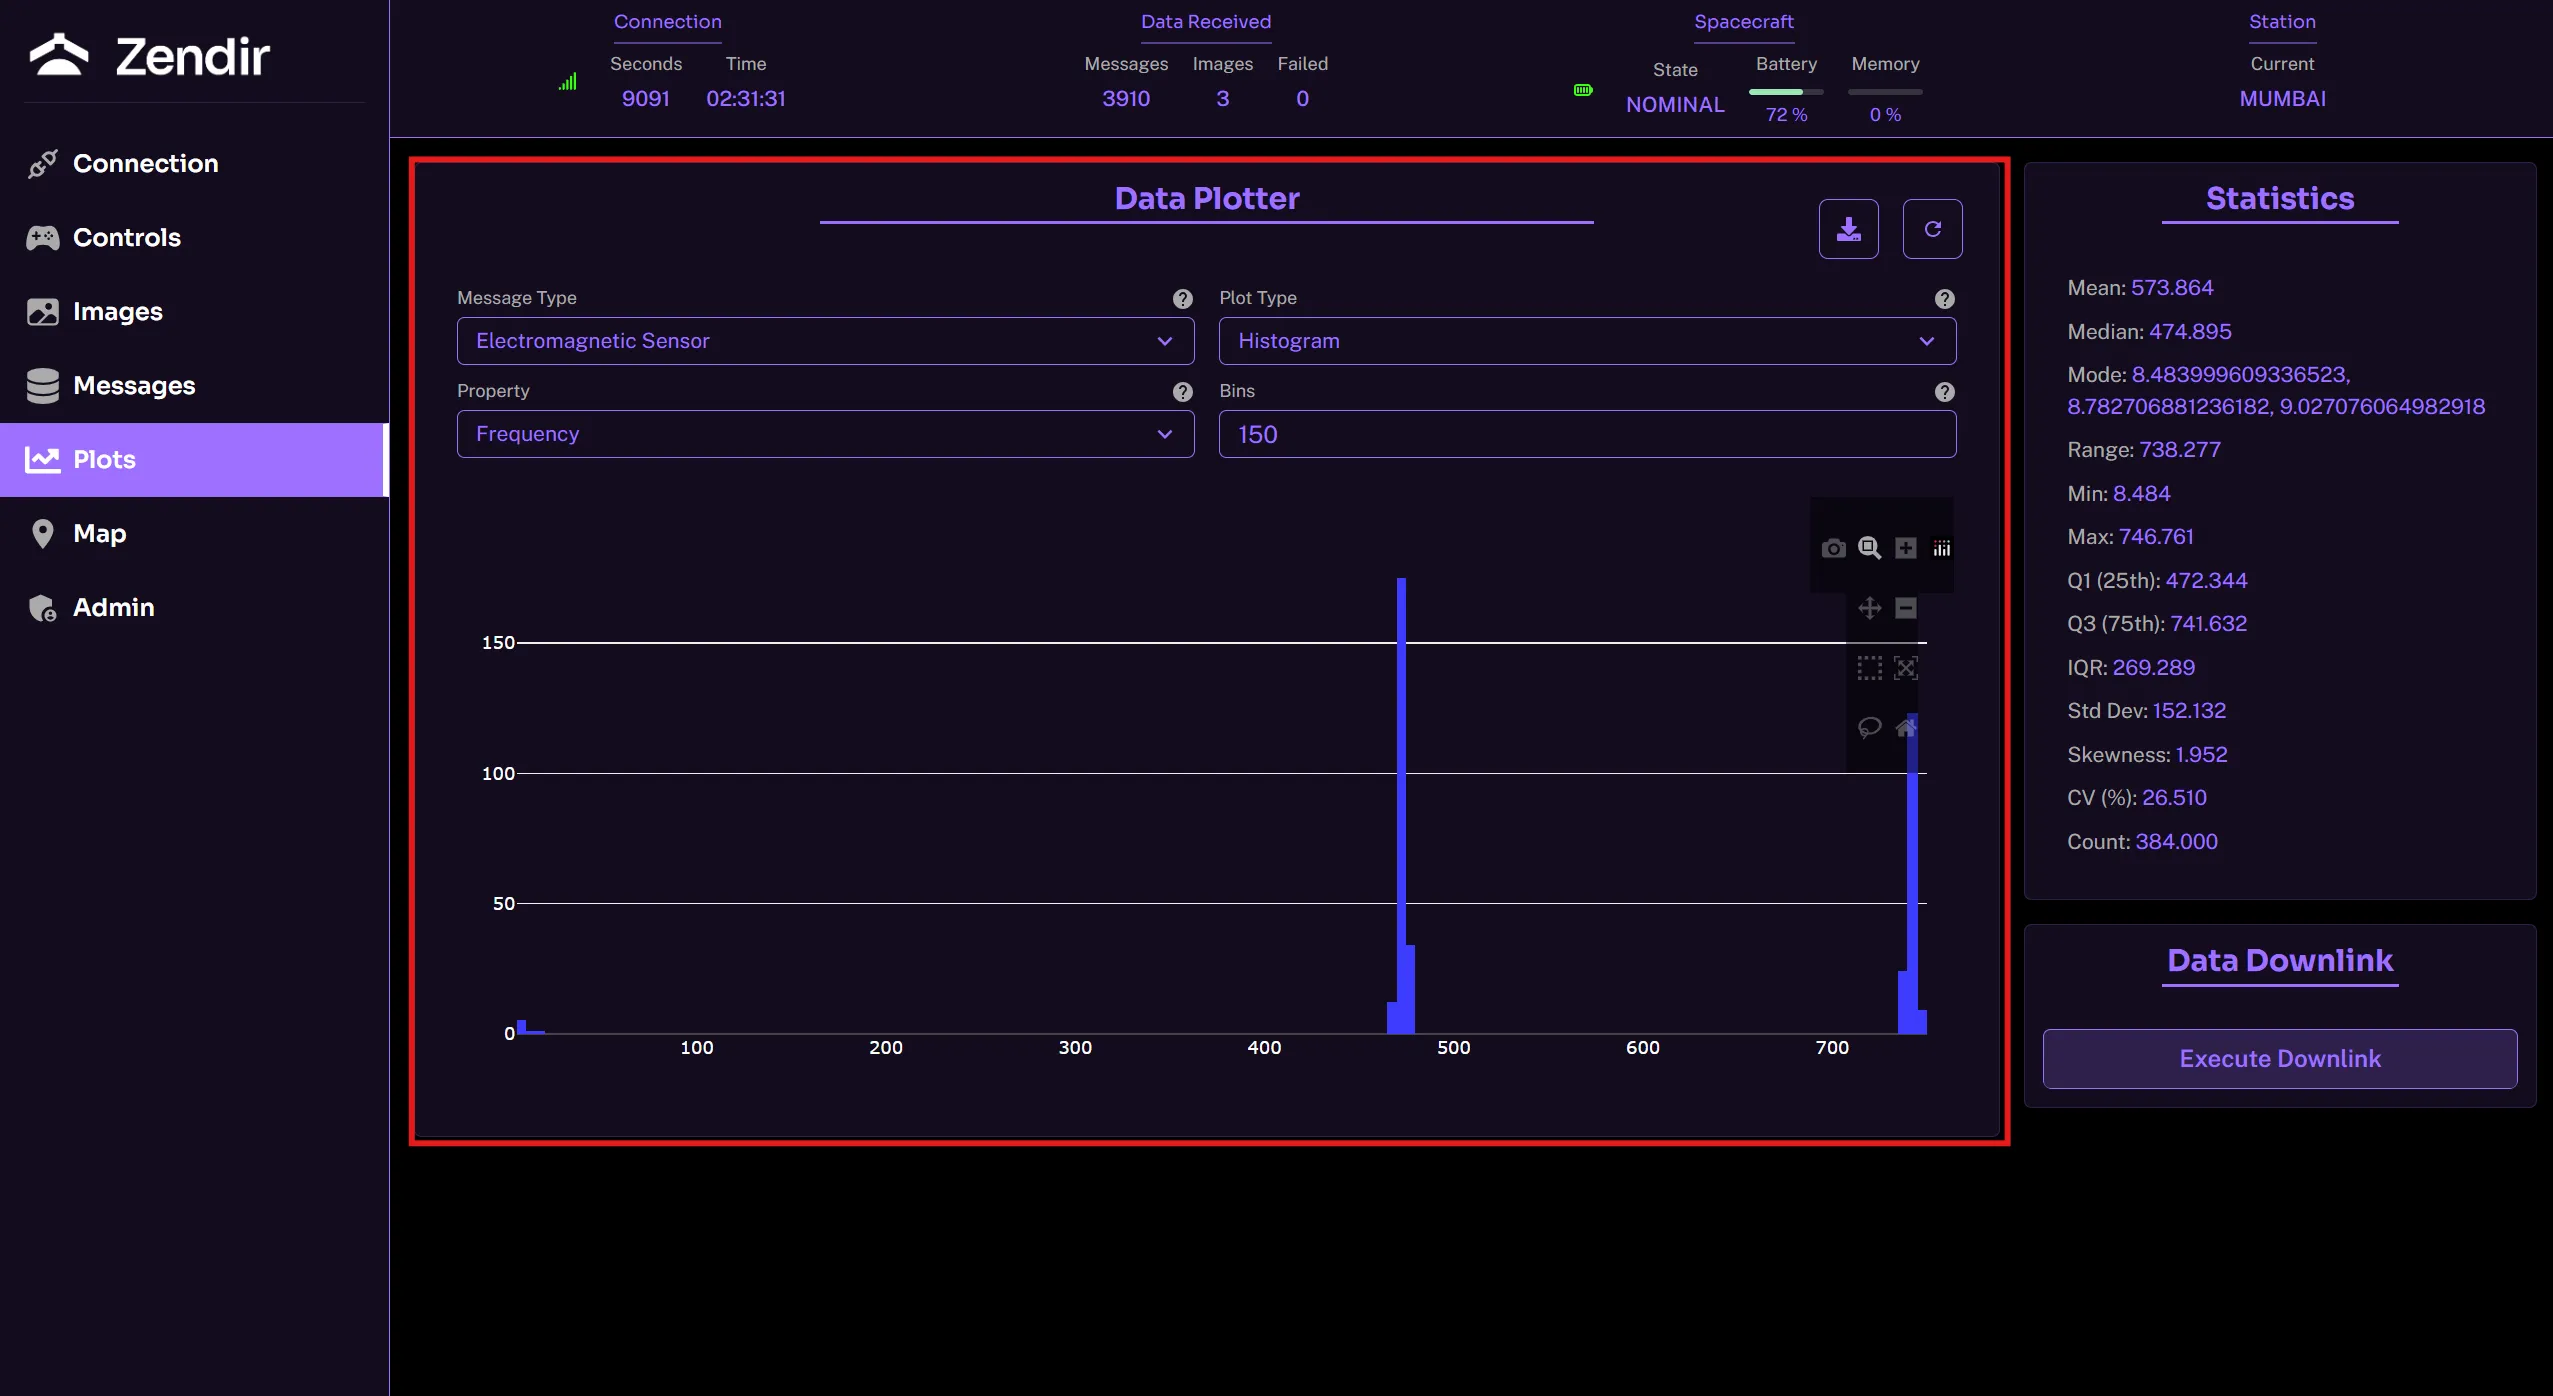
The data plotter enables the user to plot any downlinked and decrypted data.

- Message Type: Select the type of message or component of interest the user would want to analyze.
- Property: The drop down menu provides an array of data to choose from to plot relative to message type.
- Plot Type: Enables the user to choose from a variety of plots such as Line, Scatter, Heatmap, Bar and Histogram.
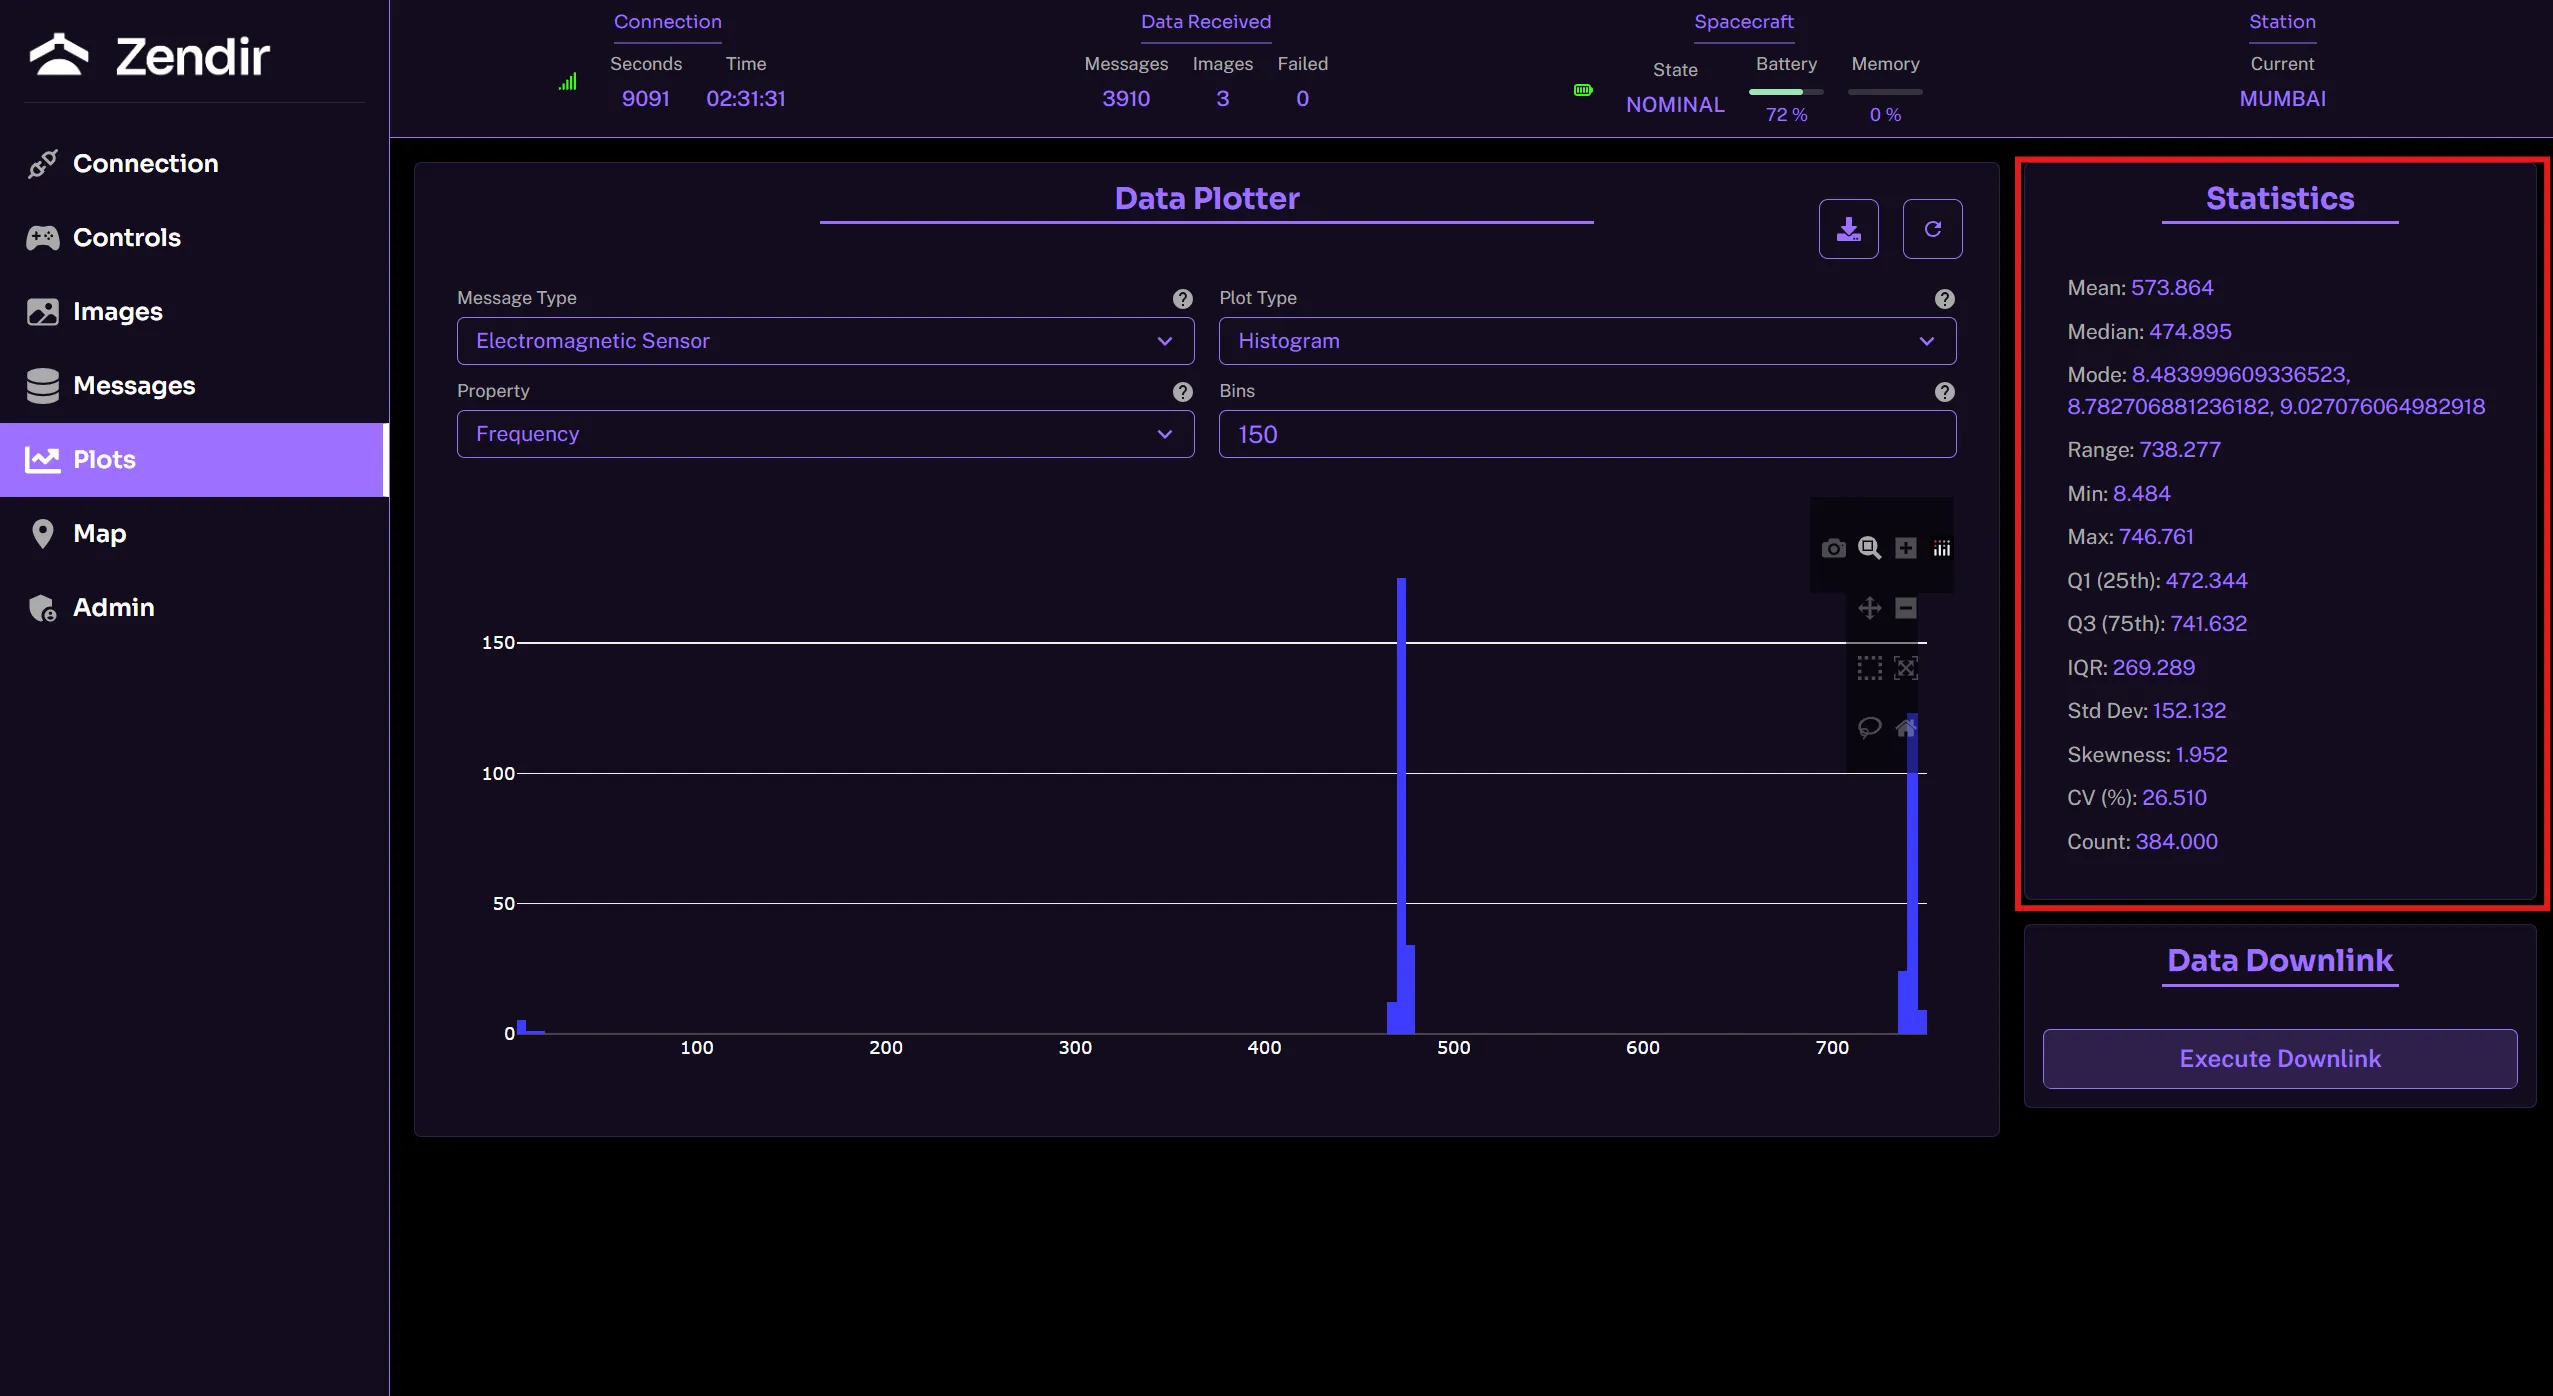
Statistics
Based on the data and message that has been selected for plotting the Statistics panel provides a statistical overview of the data being presented.

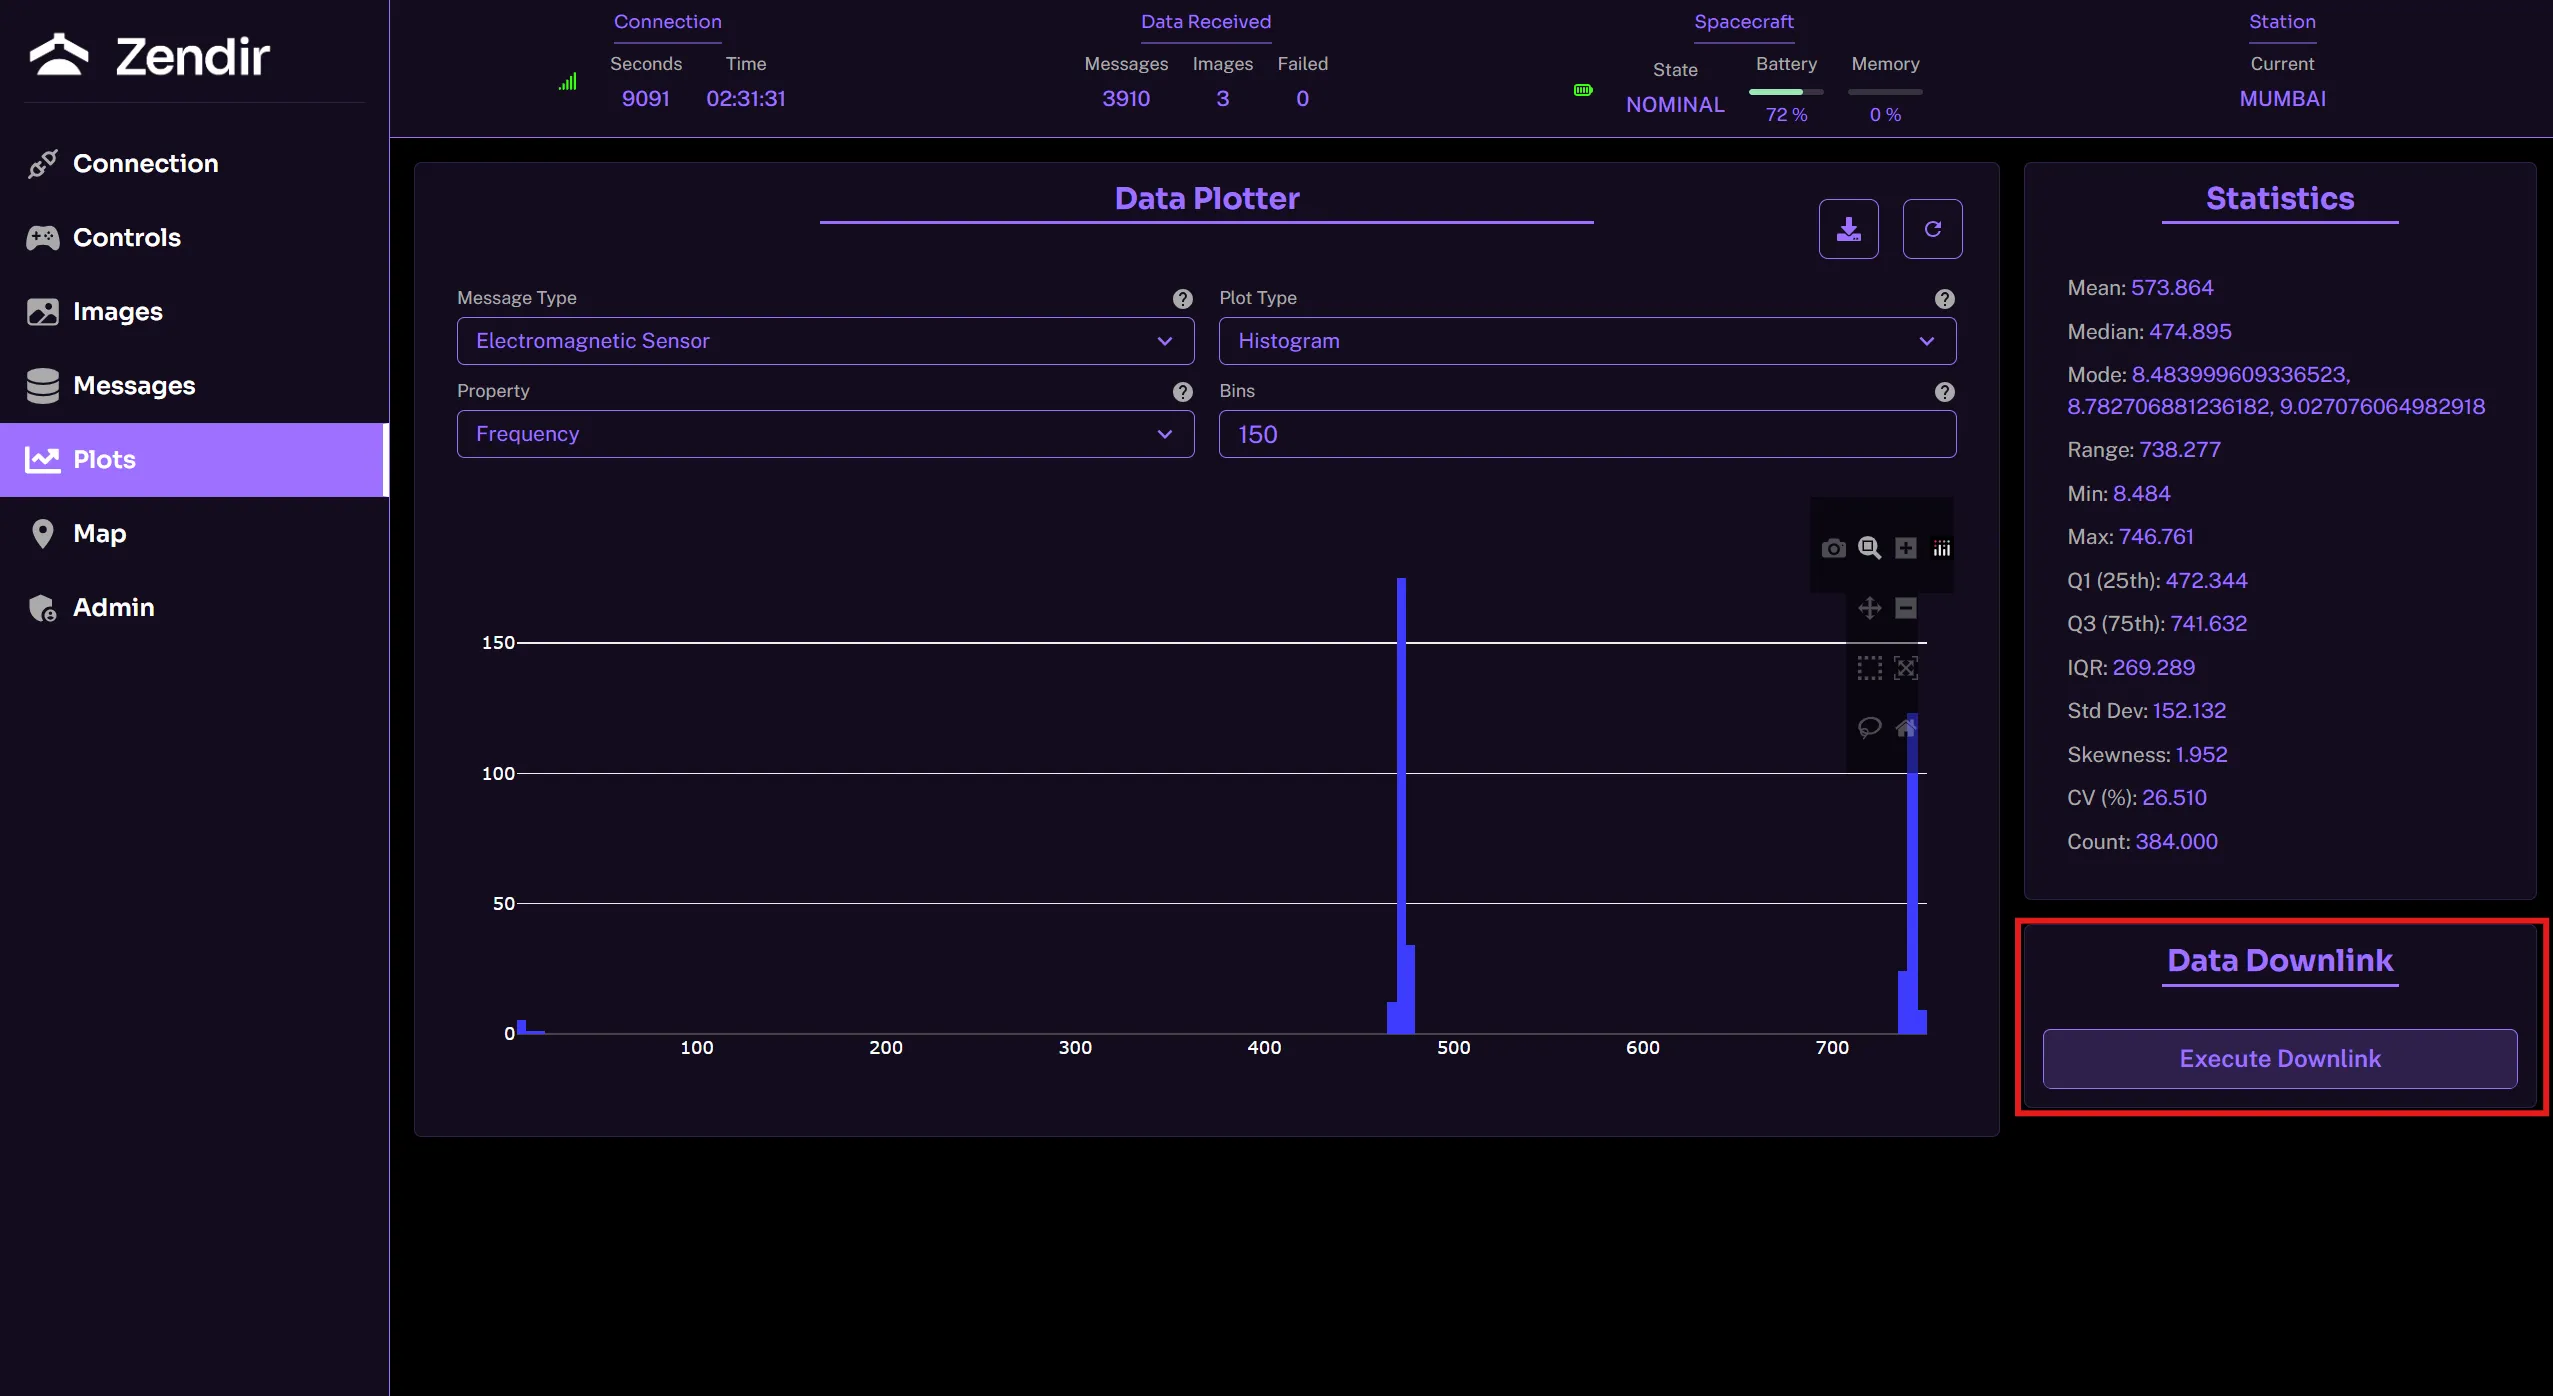
Data Downlink
Similar to the other control views, data can be downlinked from this widget. The data is downlinked from the spacecraft to the ground station in the same way it is explained in the Controlling the Spacecraft page.
