
Open Plots under Analytics when you want to watch a telemetry value over time: battery state, temperatures, pointing error, or any other numeric field your spacecraft is sending.
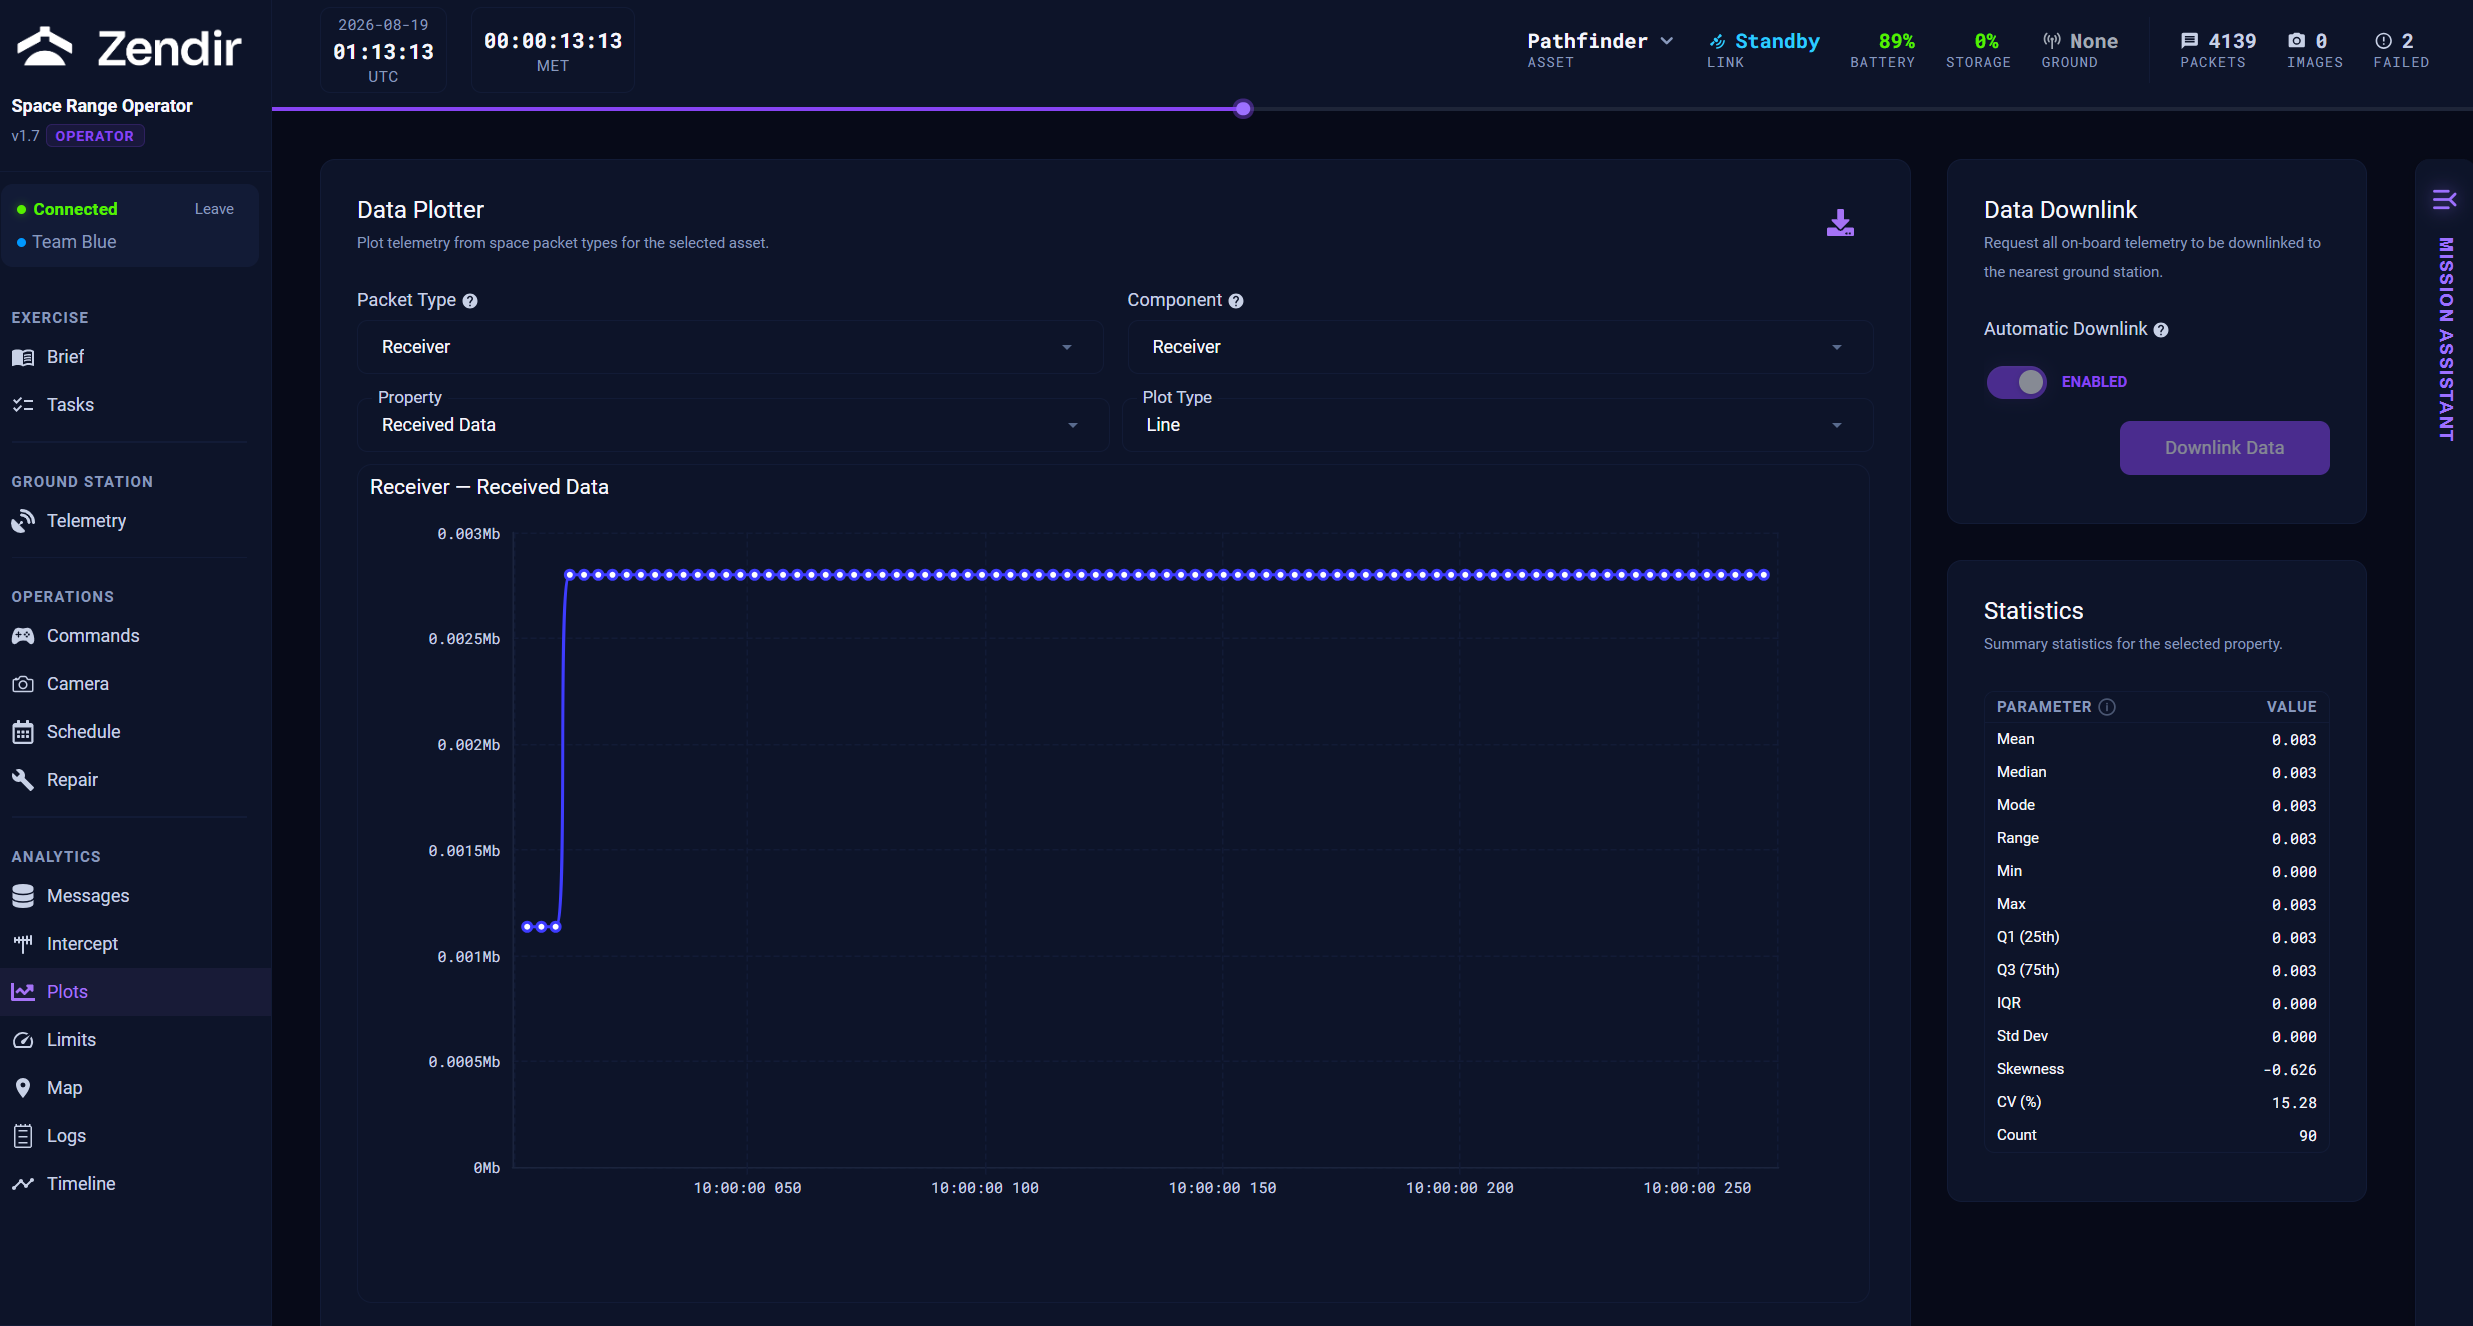
Data Plotter
- Choose a Packet Type (the kind of telemetry message).
- Choose the Component / property you care about.
- Pick a plot type (Line is the usual choice for time series).
The chart updates as new samples arrive. Export to CSV from the plot toolbar when you want a copy for notes or debrief.
Schedule reports and configuration reports are not useful plot sources. Stick to ping / sensor style telemetry.
Statistics
The Statistics sidebar summarises the selected property (useful ranges, spread, and similar overview numbers) so you can spot a bad reading without staring at every point.
Getting data onto the plot
Plots only show what you have already received. If the chart is empty:
- Confirm the simulation is running and your link is up (Troubleshooting)
- Request a Downlink Data from Commands or Camera
- Check Messages to see whether packets are arriving at all
You can also use the Data Downlink control on this page. It is the same downlink path as elsewhere.