
Open Messages under Analytics to inspect the raw telemetry your team has received. This is the decoded CCSDS Space Packet feed, not a chat window.
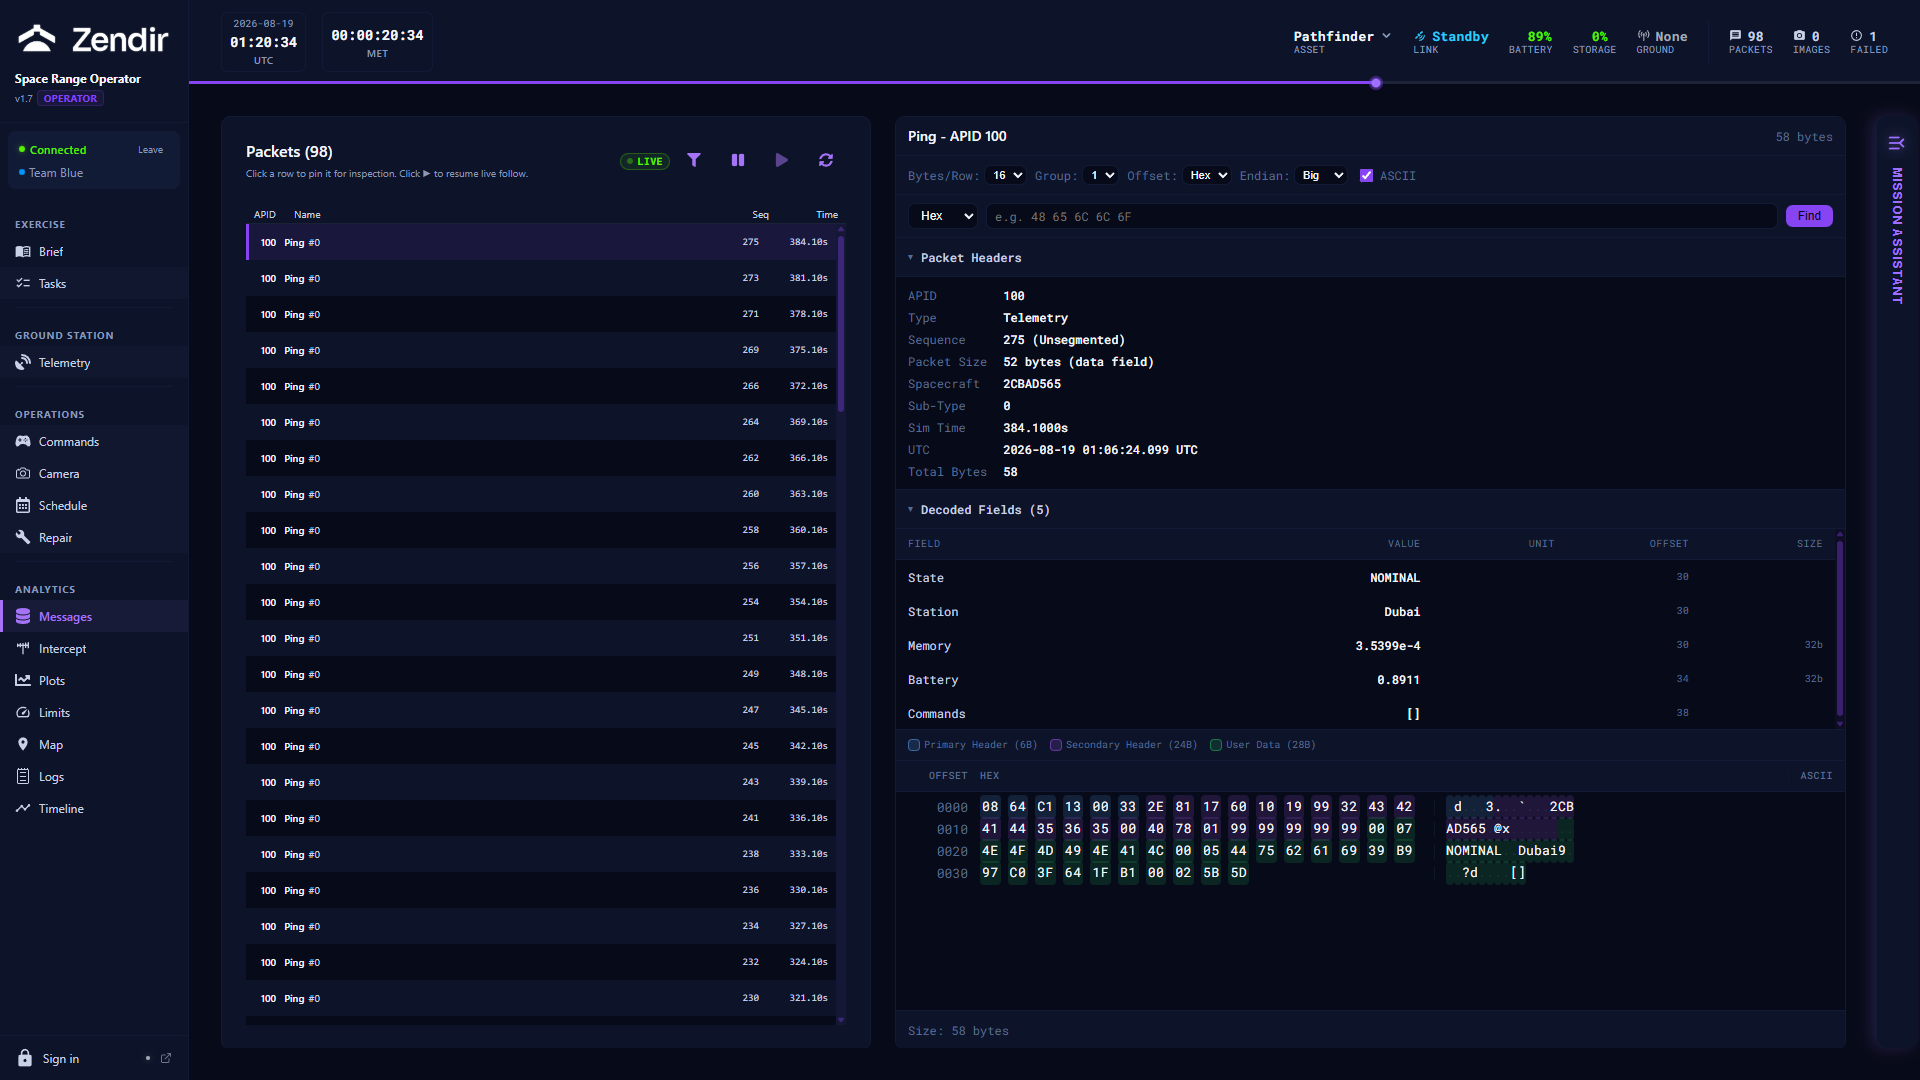
Packet feed
The left side lists packets as they arrive:
- APID: application process ID
- Name: packet / telemetry name from the schema
- Seq: sequence count
- Time: when it was received in the session
Click a row to pin it for inspection. Use the live-follow control to resume auto-scrolling when you are done looking at a single packet.
If the list is empty, you have not received packets yet. Confirm you are joined, the simulation is running, and you have a downlink path. See Troubleshooting.
Packet Detail
The detail panel shows the contents of the selected packet against the active telemetry schema. Use this when you need to verify a sensor reading, confirm a configuration report, or understand exactly what the spacecraft just sent.
Related panels
- Plots: chart numeric fields from the same telemetry stream
- Intercept: captured foreign uplinks (only when intercept is enabled for your asset)
- Repair: download packet schemas (XTCE) if you need the definitions offline
NOTE
Older Operator versions had a manual decrypt-key message viewer. The current tool decrypts team traffic as part of the connection, then shows you the resulting Space Packets here.